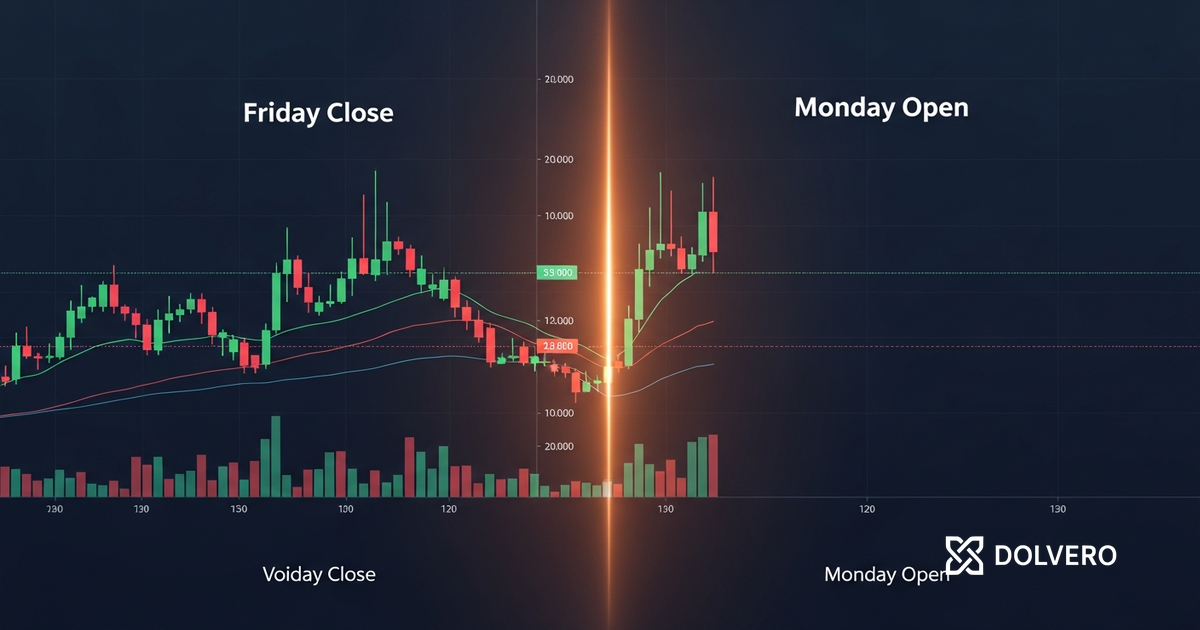


The trailing drawdown is the most misunderstood mechanism in prop trading. Traders who come from static drawdown environments — where the floor stays fixed at the initial balance minus a percentage — encounter the trailing model and assume it works the same way. It does not. The trailing drawdown follows you upward, and once it moves, it never moves back down. This single property changes every aspect of how you manage risk, take profit, and size positions.
Dolvero's 1-Step Accelerated evaluation uses a 6% trailing drawdown alongside a 3% daily loss limit and a 10% profit target. The combination is deliberately aggressive — it is designed for experienced traders who can reach a significant profit target in a single phase while managing a tighter drawdown envelope than the standard 2-Step evaluation provides. This article explains exactly how the trailing mechanism works, how it interacts with your trading, and what strategies give you the best probability of surviving it.
The Mechanics of Trailing Drawdown
A trailing drawdown works by tracking the highest equity your account has ever reached — the high-water mark (HWM) — and setting the termination floor at a fixed percentage below that level. In the 1-Step evaluation, that percentage is 6%.
Here is how it moves in practice. You start with a $100,000 account. Your initial HWM is $100,000 and your floor is $94,000 (6% below). On your first day, you make $1,500. Your equity is now $101,500. The HWM updates to $101,500 and the floor rises to $95,410. The next day, you lose $800. Your equity drops to $100,700. The HWM does not change — it stays at $101,500 because equity has not exceeded it. The floor stays at $95,410.
The following day, you make $2,000. Equity hits $102,700. The HWM updates to $102,700 and the floor rises to $96,538. Then you have a flat day — no trades, no change. The HWM and floor remain where they are.
Then a bad day: you lose $3,000. Equity drops to $99,700. The floor is still $96,538. You have $3,162 of breathing room — not the $5,700 you would have if the floor had stayed at $94,000. The trailing mechanism has consumed $2,538 of your original buffer during your profitable days.
The Critical Property: It Never Trails Down
The HWM only moves in one direction: up. When your equity rises above the previous HWM, the floor rises with it. When your equity falls, the HWM does not fall, and neither does the floor. This means that every dollar of profit you make permanently reduces your available drawdown buffer — unless you are adding to your total equity faster than the floor is consuming it.
This creates a paradox that confuses many traders: making money makes you more vulnerable, not less. In a static drawdown model, a trader who grows their account from $100,000 to $110,000 has gained $10,000 of additional buffer — the floor is still at $90,000 and they are $20,000 above it. In a 6% trailing model, the same trader's floor has risen to $103,400 and they are only $6,600 above it. They have made $10,000 in profit but gained only $600 in additional buffer.
The implication is profound: in a trailing drawdown environment, you cannot "bank" safety margin through profit. Every new high is simultaneously a new risk point. This is the fundamental reason the 1-Step evaluation is described as accelerated — it is not only faster (one phase instead of two), it is structurally more demanding on risk management.
How the 3% Daily Loss Limit Interacts with Trailing Drawdown
The 1-Step evaluation also enforces a 3% daily loss limit. This is calculated from the account balance at the start of the trading day — not from the HWM. On a day when your opening balance is $103,000, your daily loss limit is $3,090. If your floating plus realised losses for the day reach this figure, your account locks.
Here is where the interaction becomes critical. Your trailing drawdown floor might be at $98,000 (6% below a HWM of $104,255). Your daily limit might allow a loss of $3,090 from today's opening balance of $103,000 — which would bring you to $99,910. In this scenario, the daily limit is more restrictive than the trailing floor. But on a different day, if your opening balance is $99,500 (after a drawdown) and your trailing floor is $98,000, the daily limit is $2,985 — bringing you to $96,515 — which is below the trailing floor. Here, the trailing floor is more restrictive and would terminate the account before the daily limit is reached.
The practical rule: at any given moment, you are governed by whichever limit is closer. You must track both. Full details of both limits are on the rules page.
Real Scenario: The Classic Trailing Drawdown Failure
Let us walk through the most common way traders fail a 1-Step evaluation. This scenario plays out with remarkable consistency across all prop firms that use trailing drawdown.
A trader starts with $100,000. Over the first week, they trade well and grow the account to $107,000. The HWM is $107,000 and the floor is $100,580. The trader has $6,420 of breathing room — but notice that the floor has already risen above the starting balance. A drawdown back to $100,000 — which represents zero net profit — would breach the account.
The trader then has two mediocre days, losing $1,200 and $800 respectively. Equity is now $105,000. The floor is still at $100,580. Available buffer: $4,420. The trader feels the psychological pressure of having been at $107,000 and now sitting at $105,000. They increase position size to "get back to the high." On the next trade, they lose $2,500. Equity: $102,500. Buffer: $1,920.
Now the trader is in crisis mode. They have $1,920 before termination on a $100,000 account — less than 2% effective margin. One more bad trade and the account is over. The trader either freezes and cannot trade, or they take one more aggressive position that fails, and the account breaches.
This sequence — strong start, floor rises, normal drawdown, floor catches up, panic, breach — is the modal failure pattern for trailing drawdown accounts. Understanding it is the first step to avoiding it.
Strategies for Surviving Trailing Drawdown
Strategy 1: Lock in the Floor at Breakeven
The first structural goal in any trailing drawdown account is to reach a profit level where the trailing floor rises to your starting balance. At 6% trailing drawdown, this happens when your equity reaches approximately 106.4% of starting balance — on a $100,000 account, roughly $106,400. At this point, even if you draw down all the way to the floor, you have lost "only" the profit you generated. The account terminates at the starting balance, not below it. This is a psychological anchor — reaching this level means your downside is limited to forfeiting the evaluation fee and your time, not suffering the additional pain of an account that ended below where it started.
Strategy 2: Reduce Size After Strong Days
The most effective tactical adjustment is counter-intuitive: reduce your position size after profitable sessions. When you are trading well and profits are accumulating, the trailing floor is rising with every new equity high. Each additional dollar of profit raises the floor, reducing your effective buffer. By trading smaller after strong days, you slow the rate at which the floor rises while maintaining your ability to add incrementally to your total profit.
A practical implementation: if your normal position size is 1.0 lot on EUR/USD, reduce to 0.6-0.7 lots on the day following a session that added more than 2% to your equity. This preserves the majority of your edge while limiting the amount the floor can move against you if the next session is a loser.
Strategy 3: Never Average Down
In a static drawdown environment, averaging down a losing position has some mathematical justification — the floor is fixed, so as long as you stay above it, adding to a position at a better price can improve your average entry. In a trailing drawdown environment, this logic does not hold. The floor has already risen due to prior profits, meaning your available buffer is smaller than it appears. Adding to a losing position in a trailing drawdown account is the fastest way to breach — because the additional exposure accelerates the loss precisely when your margin for error is at its thinnest.
Strategy 4: Take Profits in Stages, Not All at Once
When a trade is profitable, consider taking partial profits at intermediate levels rather than holding the entire position for the full target. This may reduce your average R:R on individual trades, but it serves a critical function in a trailing drawdown context: each partial close locks in some realised profit and creates a smaller maximum adverse excursion if the remaining position reverses. The cumulative effect is a smoother equity curve, which produces slower floor movement and more consistent buffer preservation.
Strategy 5: Know Your Numbers Every Morning
Before placing a single trade each day, calculate three numbers: your current equity, your current trailing floor, and your available buffer. If your buffer is below 4% of account value, trade at half size. If it is below 2.5%, consider not trading at all — the risk-reward of any individual trade is distorted when your margin for error is this thin. You can track these numbers through the Live Ledger.
The Mathematical Truth About Trailing Drawdown
Here is the uncomfortable reality: a 6% trailing drawdown and a 10% profit target create a structure where you must grow your account by 10% while never being more than 6% below your highest point. Your effective risk-reward ratio on the account — the maximum you can lose relative to the minimum you must gain — is 6:10, or 0.6. This is tighter than most traders realise.
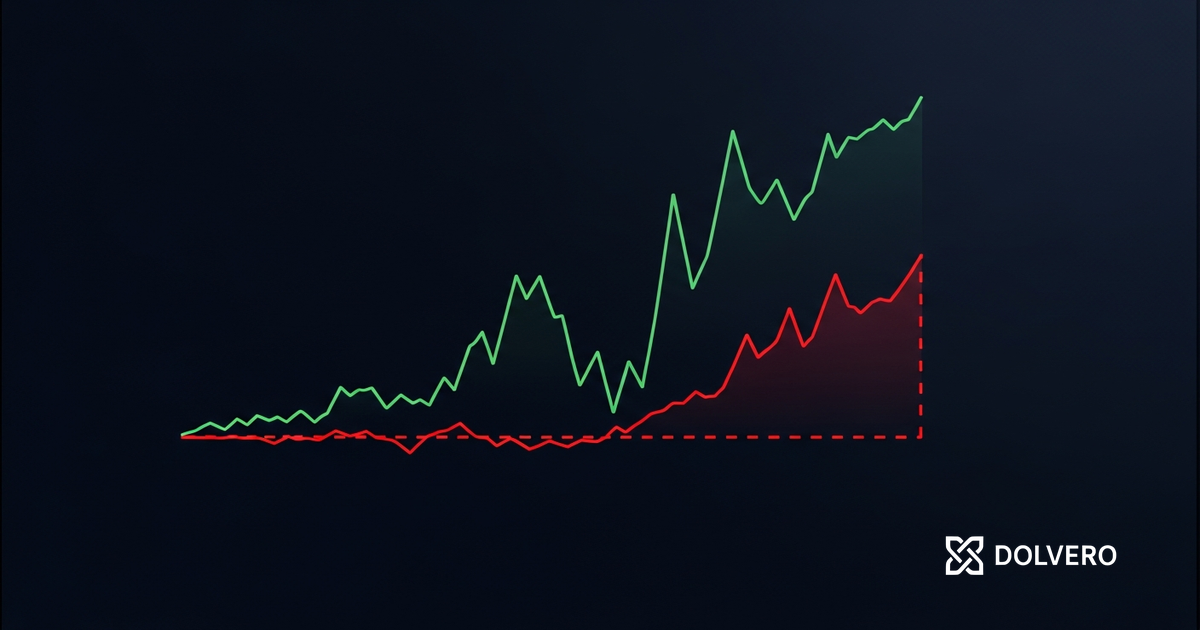
To complete the evaluation, your equity curve must reach 110% of starting balance without ever dipping more than 6% from any peak along the way. The shape of the equity curve matters as much as the destination. A straight-line ascent with minor pullbacks of 1-2% is ideal. A jagged curve with 5% swings in both directions will likely breach before reaching the target, even if the underlying strategy is profitable on average.
This is why the 1-Step evaluation is explicitly designed for experienced traders. The 2-Step evaluation offers a static 10% drawdown — twice the percentage and without the trailing mechanism. If you are unsure whether your strategy can handle a trailing drawdown, start with the 2-Step. The pricing page shows all available account options.
When the Trailing Floor Locks
On some prop firm models — though not all — the trailing floor locks at a certain point, typically when it reaches the initial account balance. Dolvero's specific implementation is documented on the rules page and in the changelog for the most current version. Regardless of whether the floor locks, the strategies described above apply universally — because the most dangerous period for trailing drawdown is the early phase when the floor is rising fastest relative to your small accumulated profits.
Putting It All Together
The trailing drawdown is not a punitive mechanism — it is a precision filter. It identifies traders who can grow an account consistently without meaningful equity regression from peaks. That is a rare skill, and the 1-Step evaluation is designed to reward it with a faster path to funding: one phase instead of two, a single 10% target instead of sequential 10% and 5% targets, and a direct line from passed evaluation to funded account.
If your strategy produces smooth equity curves with controlled maximum adverse excursion per trade, the trailing drawdown will not be a problem. If your strategy produces volatile equity curves with large swings in both directions, the trailing mechanism will likely catch you on a downswing before you reach the profit target — regardless of your overall expectancy.
Know your strategy's equity curve characteristics before starting. Test it. Measure the maximum peak-to-trough drawdown over 50-100 trades. If that number consistently stays below 4%, you are a strong candidate for the 1-Step. If it regularly exceeds 5%, the 2-Step with static drawdown is the more appropriate choice. Start your evaluation at app.dolvero.com/start when you are ready.